Volume Profile Confirmation
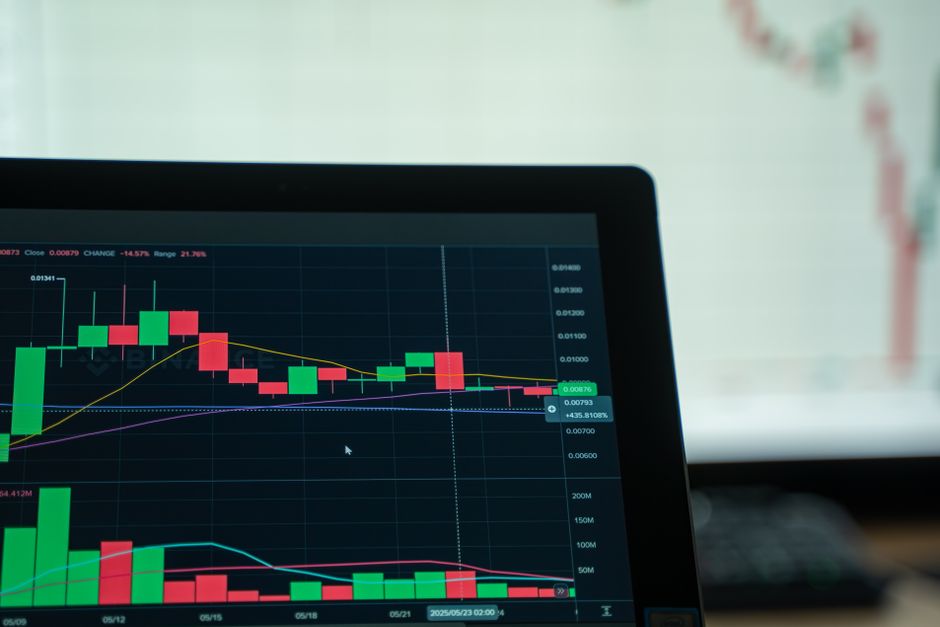
Volume profile analysis maps the distribution of trades across specific price levels to identify where liquidity resides. Every teardown orb trading review consultoriainnova has logged shows the same thing regarding the relationship between price movement and volume concentration during an intraday trading session. A breakout lacks mechanical validity if the volume at the breach does not exceed the established volume nodes of the opening range. High volume at the breakout level confirms participation, while low volume suggests a lack of conviction that often leads to a failed move back toward the mean.
Identifying the High Volume Node

The volume profile reveals the Point of Control, which is the price level with the most activity. During the first hour of regular trading hours, the profile builds a shape that defines the boundaries of the session. A successful opening range breakout occurs when price moves away from the high volume nodes and into a low volume area. If price stalls at a high volume node during a breakout attempt, the move lacks the necessary momentum to sustain itself. This stalling indicates that sellers are defending that specific price level, which prevents the trend from establishing.
Assessing Breakout Exhaustion

Exhaustion occurs when price moves into a new territory on declining volume. If the 15 minute range shows a price spike but the volume profile remains thin at those new levels, the move is likely a trap. A healthy trend requires an expansion in the volume profile at the new price levels. Without this expansion, the price will typically revert to the previous session high or the volume center. Monitoring the 30 minute range allows for the observation of whether volume is accumulating or dissipating as the price moves away from the opening bell.
The Role of the Value Area
The value area contains the price levels where a specific percentage of total volume occurred. When an opening range breakout stays within the previous value area, the breakout is invalid. Real strength is measured by the ability of price to exit the value area and stay outside of it. A shift in the volume profile toward higher or lower prices indicates a change in the balance of supply and demand. If the 60 minute range shows volume clustering at the breakout point, the new price level is being accepted by the market.
Volume Imbalance and Trend Sustainability
Volume imbalance at the breakout point separates a true trend from a momentary fluctuation. A heavy cluster of volume at the breakout level provides a floor or ceiling for future price action. During the first fifteen minutes, the profile is often too thin to provide definitive data, so waiting for the 5 minute or 15 minute profile to stabilize provides a better mechanical basis for analysis. A breakout on low volume relative to the premarket activity often results in a quick reversal toward the center of the profile.